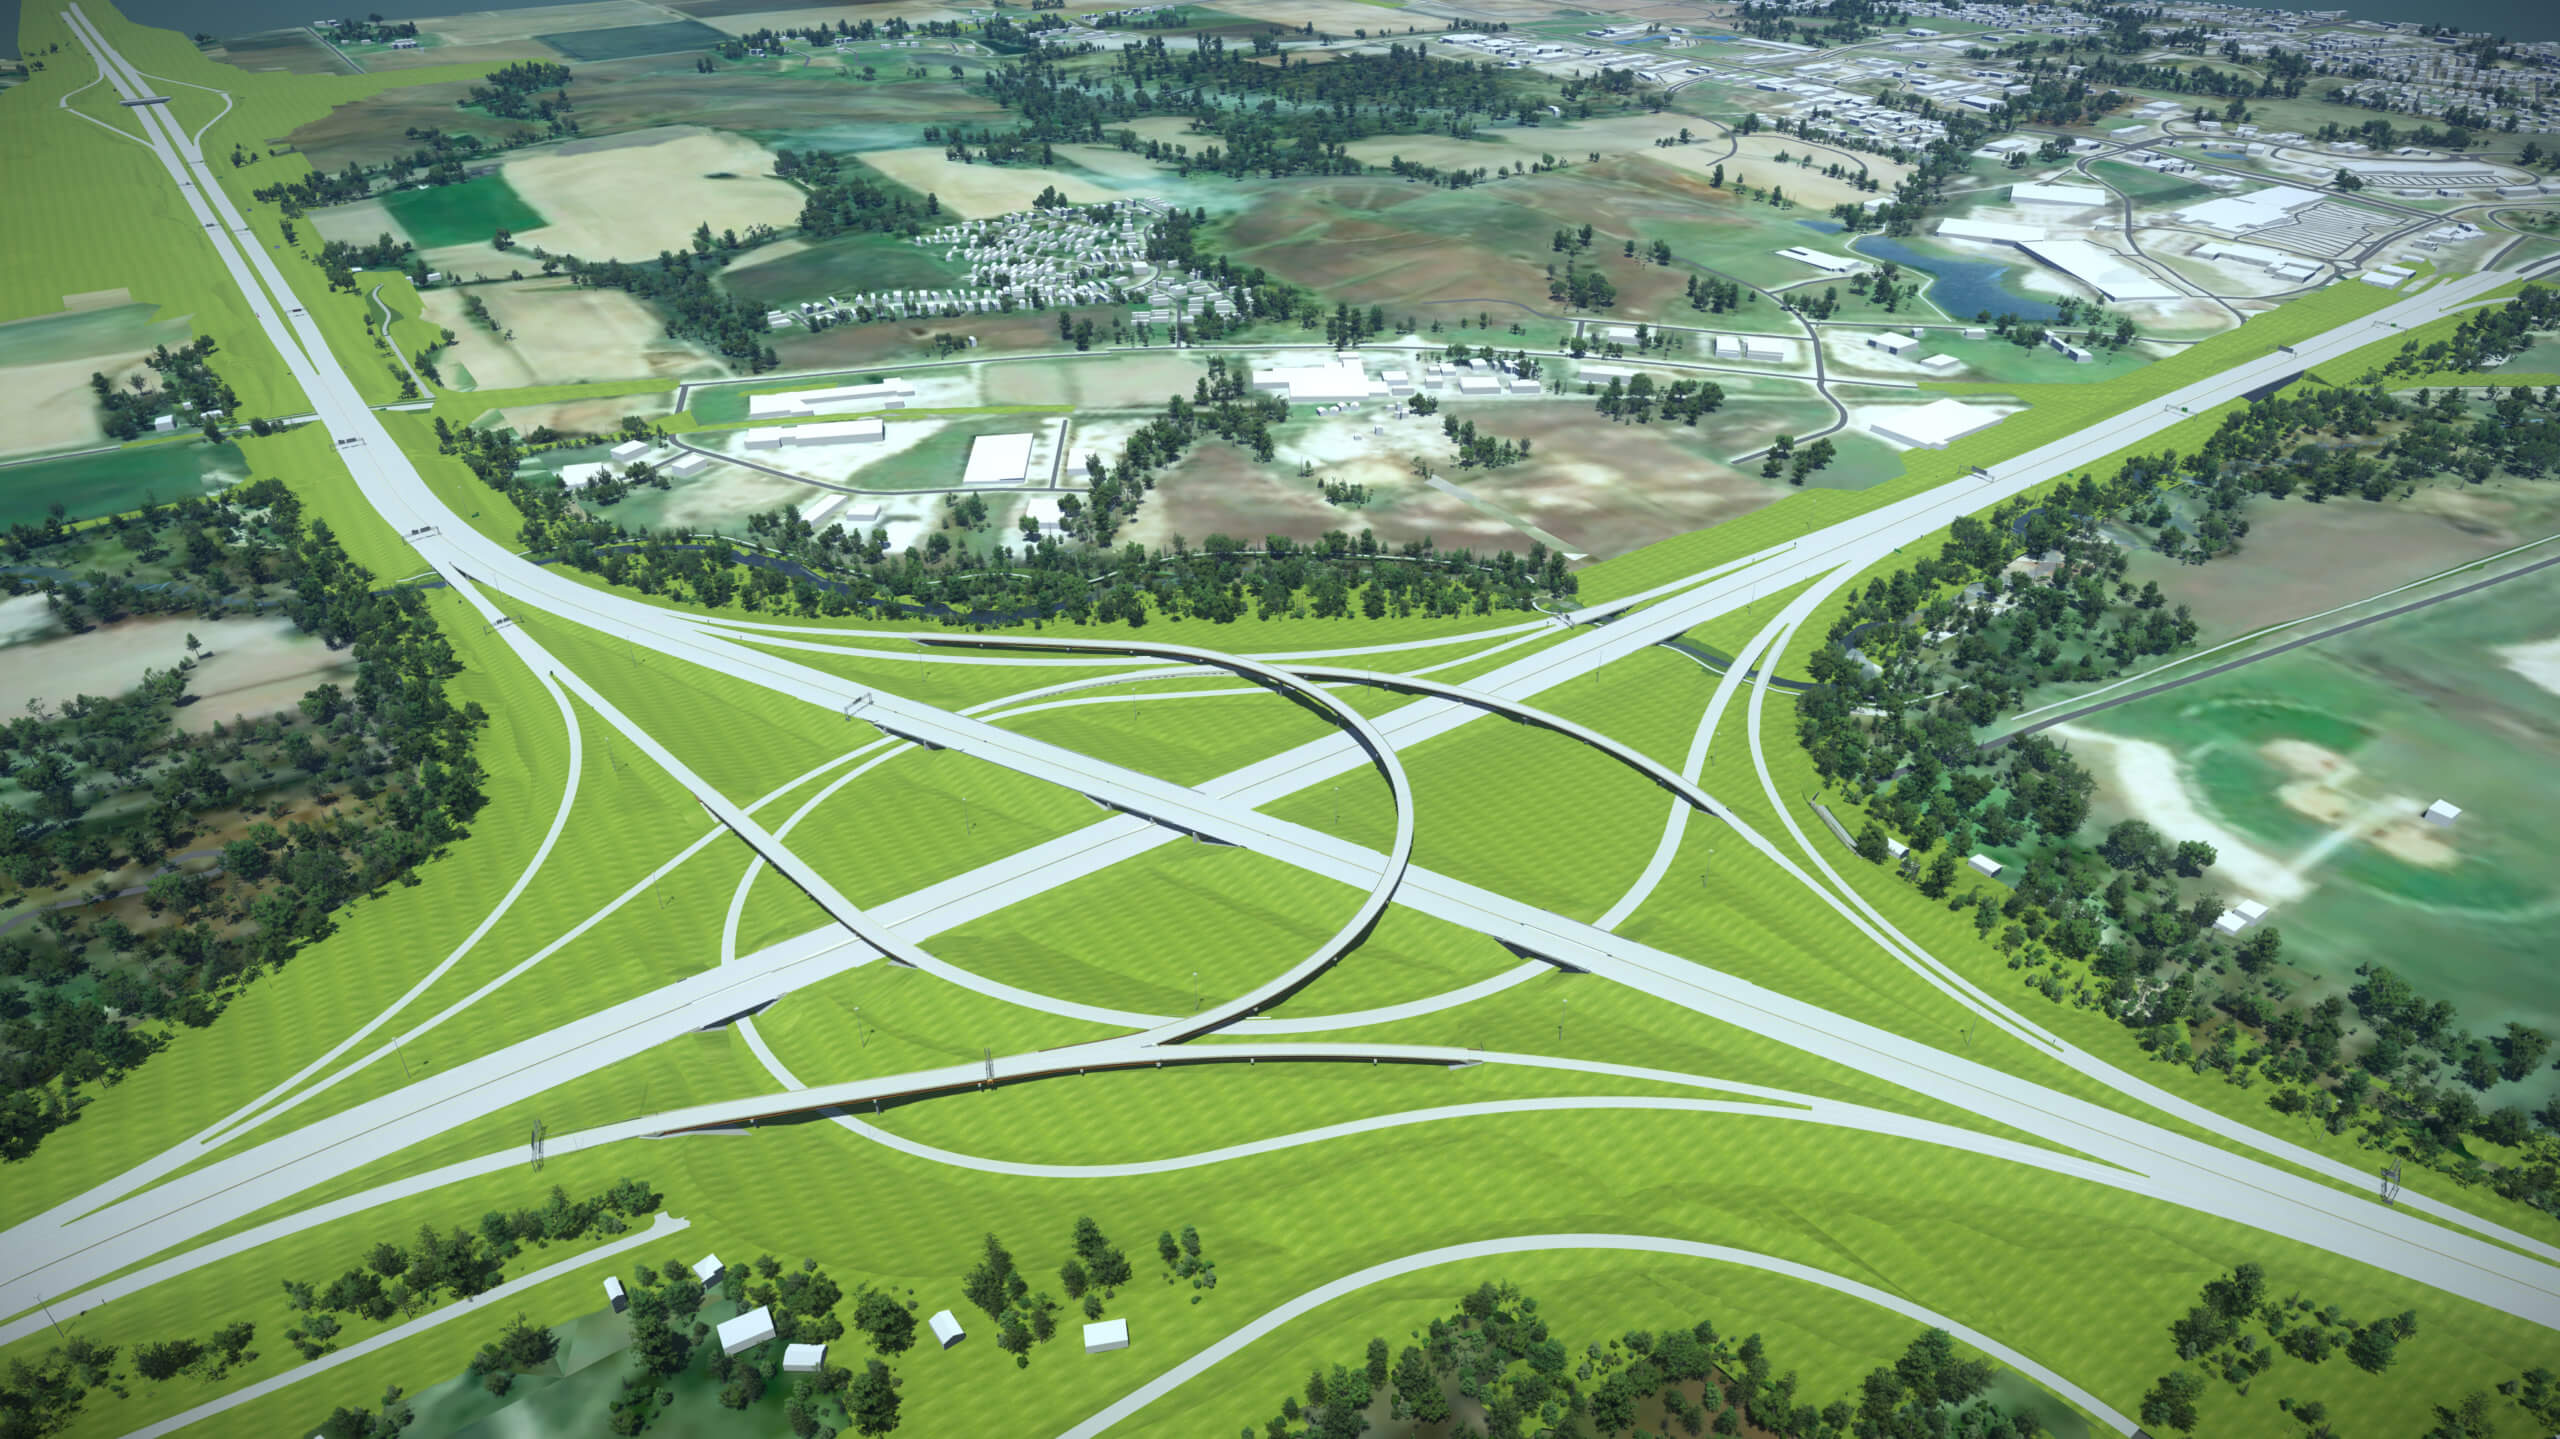
Benefits of 3D Visualization Models for Project Communication
Not everyone has the spatial ability to view a two-dimensional plan, cross-section, or profile and grasp how the design will change the current roadway environment in which they are familiar. 3D animation engineering visualization models bridge the communication gap between transportation agencies and the general public. Providing common points of reference, these 3D models improve the ability to visualize and communicate how a project will work when completed.
A successful visual model is not just a showpiece, but an active tool that boosts collaboration. Typically, the public’s main concern is with how a project will affect them directly. They want to know the impacts on their property or how and when it will affect their daily commute. A 3D model can help people visualize complex projects and give them the means to experience or explore a project before construction even begins. When someone can see something, they are better equipped to ask meaningful questions and receive clearer answers.
Stimulating Public Involvement with Animated Visualization Models
There’s no “one size fits all” approach when it comes to public involvement and engagement. Open meetings have long been used to present upcoming transportation projects to the public and other stakeholders. As technology continues to evolve, project websites are becoming more common. Websites are a great place to house images, exhibits, and videos to show a project in detail.
Project websites also provide the opportunity for the public to consume information on their own time, creating a higher likelihood of reaching a broader audience with a consistent message. Customized project websites also provide the ideal space to display animated visualization models — whether images or videos.
Animated visualization models make it easier for the public to understand the engineer’s vision of the project. They can also help to explain construction phasing, significant shifts in traffic routes before the shifts occur, and critical areas of concern, such as contractor staging areas where heavy equipment may enter or exit a roadway or interstate to conduct their work.
Design Models vs. Visualization Models
To fully understand how visualization models are created, it’s first important to understand the difference between a design model and a visualization model. Design models are what most engineers are accustomed to working with to build plan sheets and cross-sections. These models are often preliminary or conceptual 2D line work at the beginning of a project’s life.
Visualization models take that base design model information one step further. They give verticality to the 2D design information through the use of numerous software packages. When used for public consumption, they allow the viewer to imagine how a design’s improvement would appear in a three-dimensional world, well before the final design phase. Also, infrastructure components, such as bridge berms, traffic signs, bridge piers, guardrails, and even surrounding buildings gain further enhancement and clarity in the visualization model.

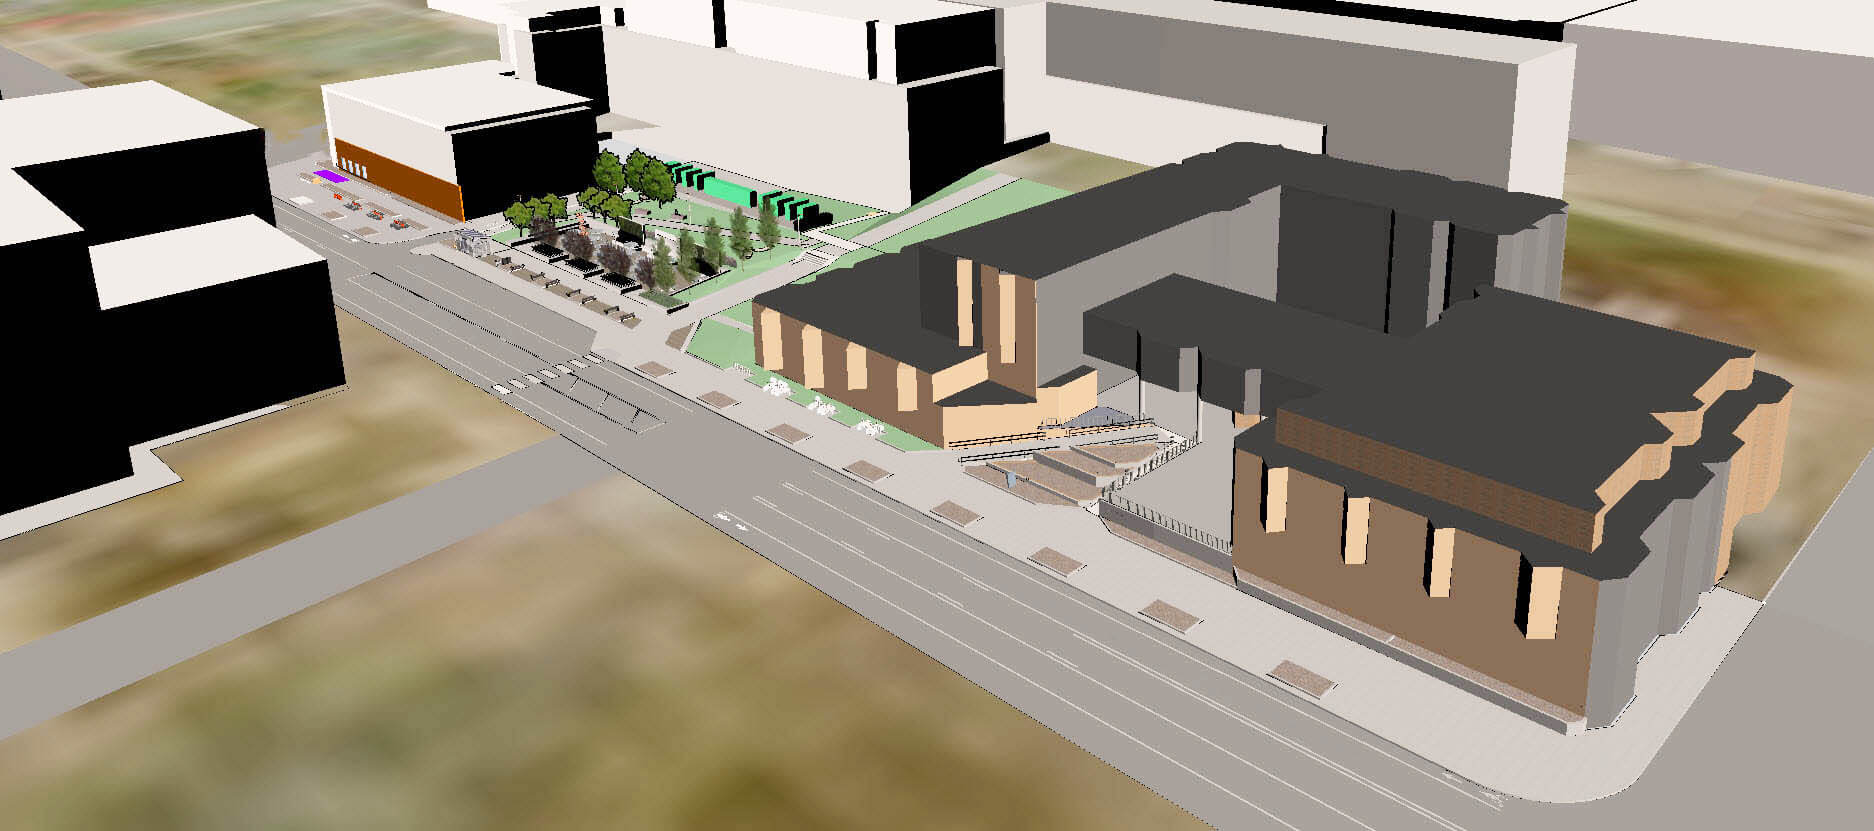
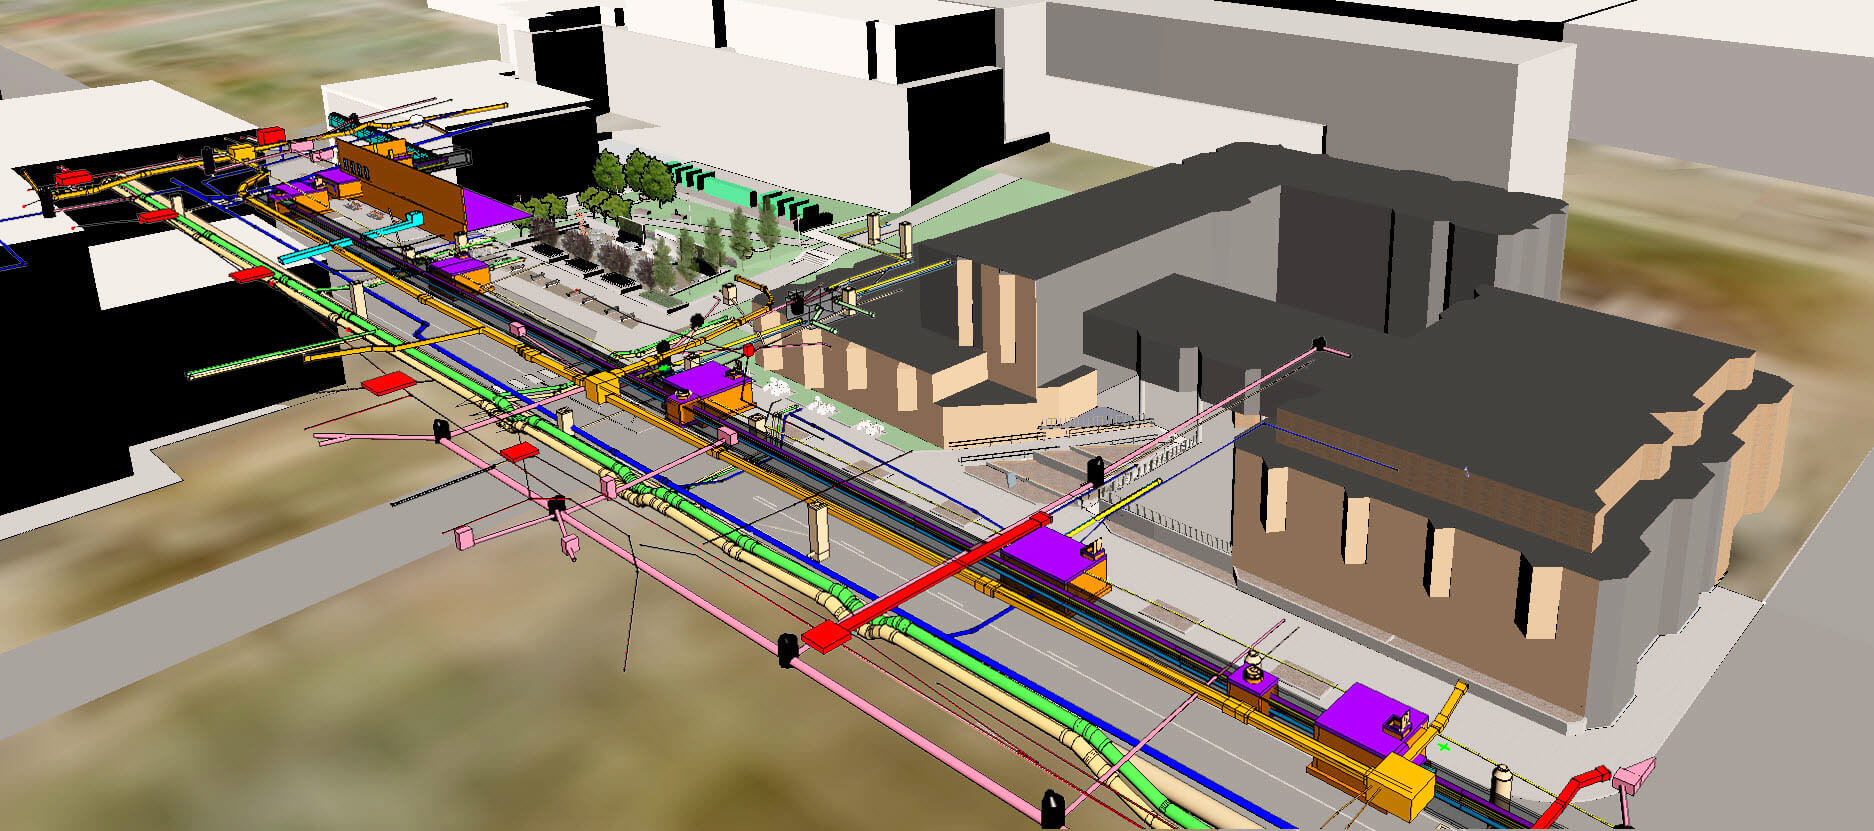
Visualization models (right) take the two-dimensional information from the design model (left) and give it three-dimensional verticality.
Numerous Benefits of Creating Animated 3D Visualization Models
Beyond being useful for public communication and engagement, visualization has other far-reaching benefits for the designers and the client. Through the process of upgrading the design from a two-dimensional design model to a three-dimensional visualization model, technicians can double-check the model. When conflicts arise, transportation design engineers are consulted and adjustments are made, avoiding costly change orders down the road.
Three-dimensional visualization solutions also create an environment in which the designers can examine a design in a real-world scenario. This includes the ability to create animated drive-through videos that “visually move” along a corridor, providing the view of what the driver of a vehicle would see as they merge into moving traffic or blind spots created by topography. Additionally, they can determine what multiple drivers would see as they share the roadway, including how various on-ramp elevations would allow all drivers to have a clearer vision of merging vehicles.
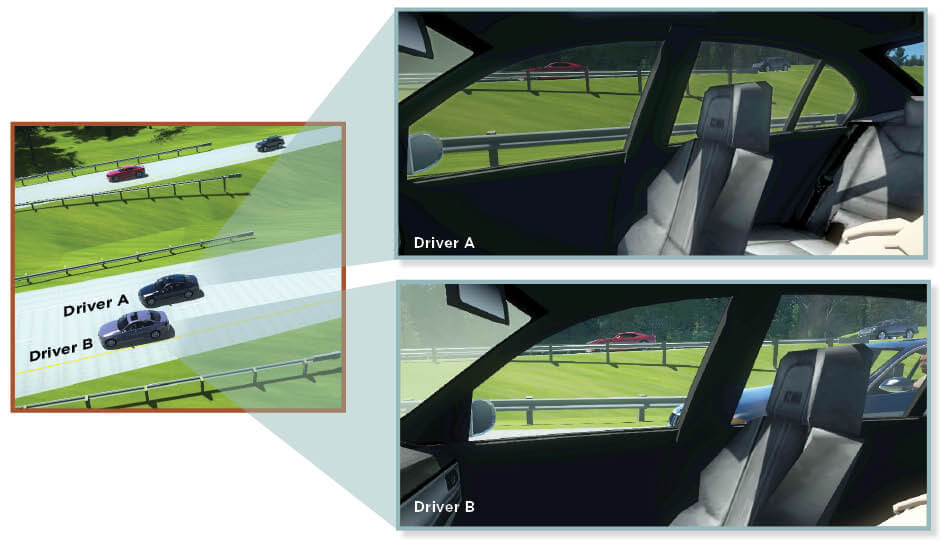
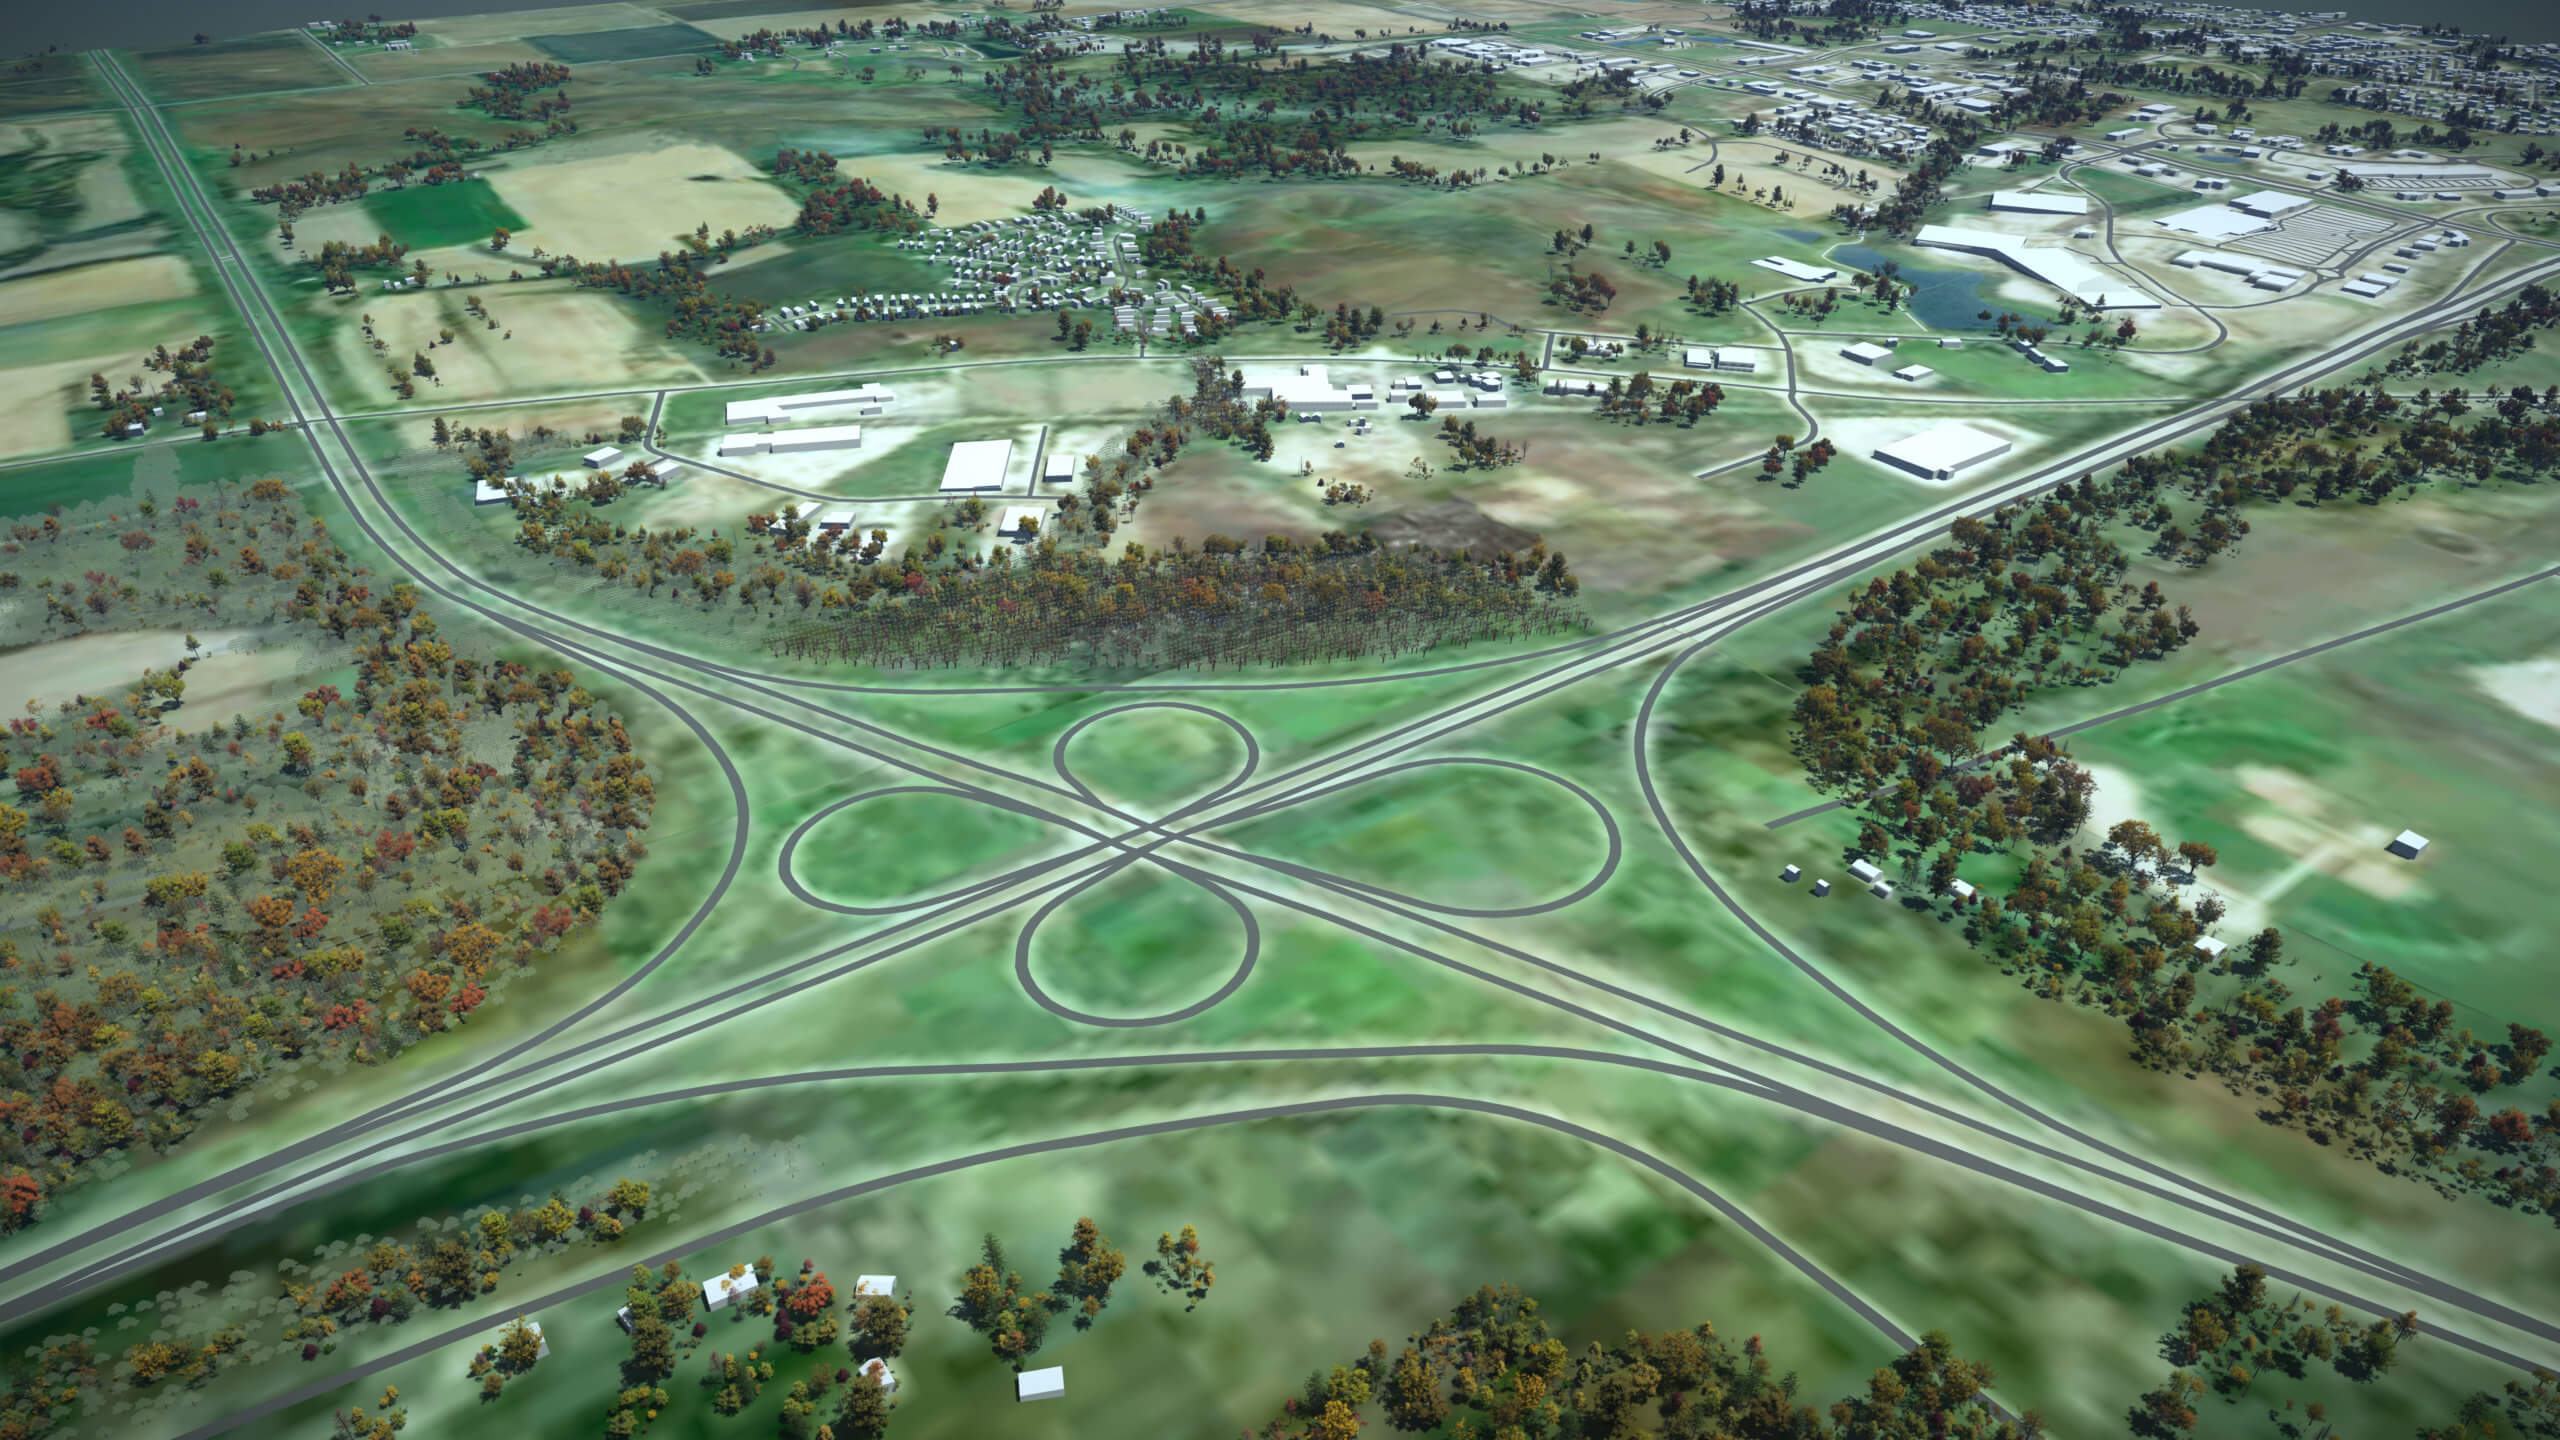
Three-dimensional drive-through visualizations provide a real-world view of a proposed roadway design from a driver’s perspective.
Drive-through animations allow the public to see what it would look like to drive some of the primary movements of a new roadway design. These animations show commuters what their new route will look like and may ease public anxiety about potential disruptions. Likewise, traffic animations, though difficult to simulate due to their inherent complexity and evolving behavior, provide valuable visual information for the drive-through videos.
Snyder & Associates Case Study #1
Interstate 80/380 Interchange Visualization “Sells” Project
The Iowa Department of Transportation (DOT) has been working on upgrading the existing full cloverleaf interchange at the junction of Interstate 80 and 380 into a new configuration that improves safety and increases the capacity of the major crossroads in the area. Located in the west-central part of Coralville, the intersection serves as the primary crossroads to one of the more densely populated and fastest-growing regions in eastern Iowa.
The Iowa DOT contacted Snyder & Associates to create a 3D digital model that could be utilized as a visualization tool to educate the public on this “new to Iowa” turbine interchange design. Our team developed a process to create a model that communicates to the public how the new interchange will function once complete. The three specific and targeted outcomes of the visualization project were to create drive-through videos of the major traffic movements, make a video showcasing the new interchange configuration, signage, lighting, and bridge aesthetics, and produce a video summarizing construction phasing by calendar year.
Using animated visualization models also provides the perfect environment for addressing unique situations and requests. With the current cloverleaf configuration at the interchange, wind turbine blade transport vehicles find it difficult to maneuver the loop ramp without causing significant delays to traffic. The Iowa DOT asked our team to develop a modeled scenario that portrays how these vehicles would maneuver through the northbound to the westbound ramp of the new interchange. Working directly with our software vendors, we were able to provide a custom vehicle for this particular traffic animation.
The visualization model can be utilized for any number of applications. Videos, still imagery, display drawings, detailed illustrations, and virtual reality uses are all examples of applications that can be used to educate the public. Split-screen videos can be implemented to seamlessly compare the before and after-effects of the improvements. A staging video of the I-80/380 project was also developed to help educate the general public on how this turbine interchange will come together. The addition of subsequent video clips when construction was underway focused on traffic impacts during construction.
Creating detailed visualization models is a complicated process and extensive collaboration is essential for achieving a quality product. Our team worked closely with the Iowa DOT and numerous software partners to compile all of the necessary information we required to develop the visualization models and various video productions for the I-80/380 project.
Snyder & Associates Case Study #2
Closes Creek Stormwater Modeling Leads to Cost-Effective Solutions
The use of visualization modeling isn’t just for large, multi-faceted projects, either. It can be equally beneficial for almost any size project. The Closes Creek Watershed on Des Moines’ north side is a prime example. This watershed has experienced repeated flooding events throughout the years, with recurrent property damage upsetting homeowners. This issue was mainly attributed to the undersized and aging stormwater conveyance system which featured outdated technologies such as brick, limestone, and timber culverts. Snyder & Associates was brought on board to analyze the storm sewer system and determine the best course of action to repair and replace the antiquated infrastructure. We once again turned to modeling techniques during the planning stages to help educate the public.
Once topographic and survey data were collected, our team analyzed the watershed’s hydrologic and hydraulic characteristics through modeling techniques and produced realistic flood elevations in streets and between homes. These visualization techniques provided a straightforward method for relaying critical pieces of the project to the public and other stakeholders.
This unique service provided by Snyder & Associates is just one more way we can help our clients gain a clear concept of a project before plans are created. If your next project has a design aspect that’s difficult to communicate, there’s an abundance of creative ways we can use our knowledge and expertise to assist you.
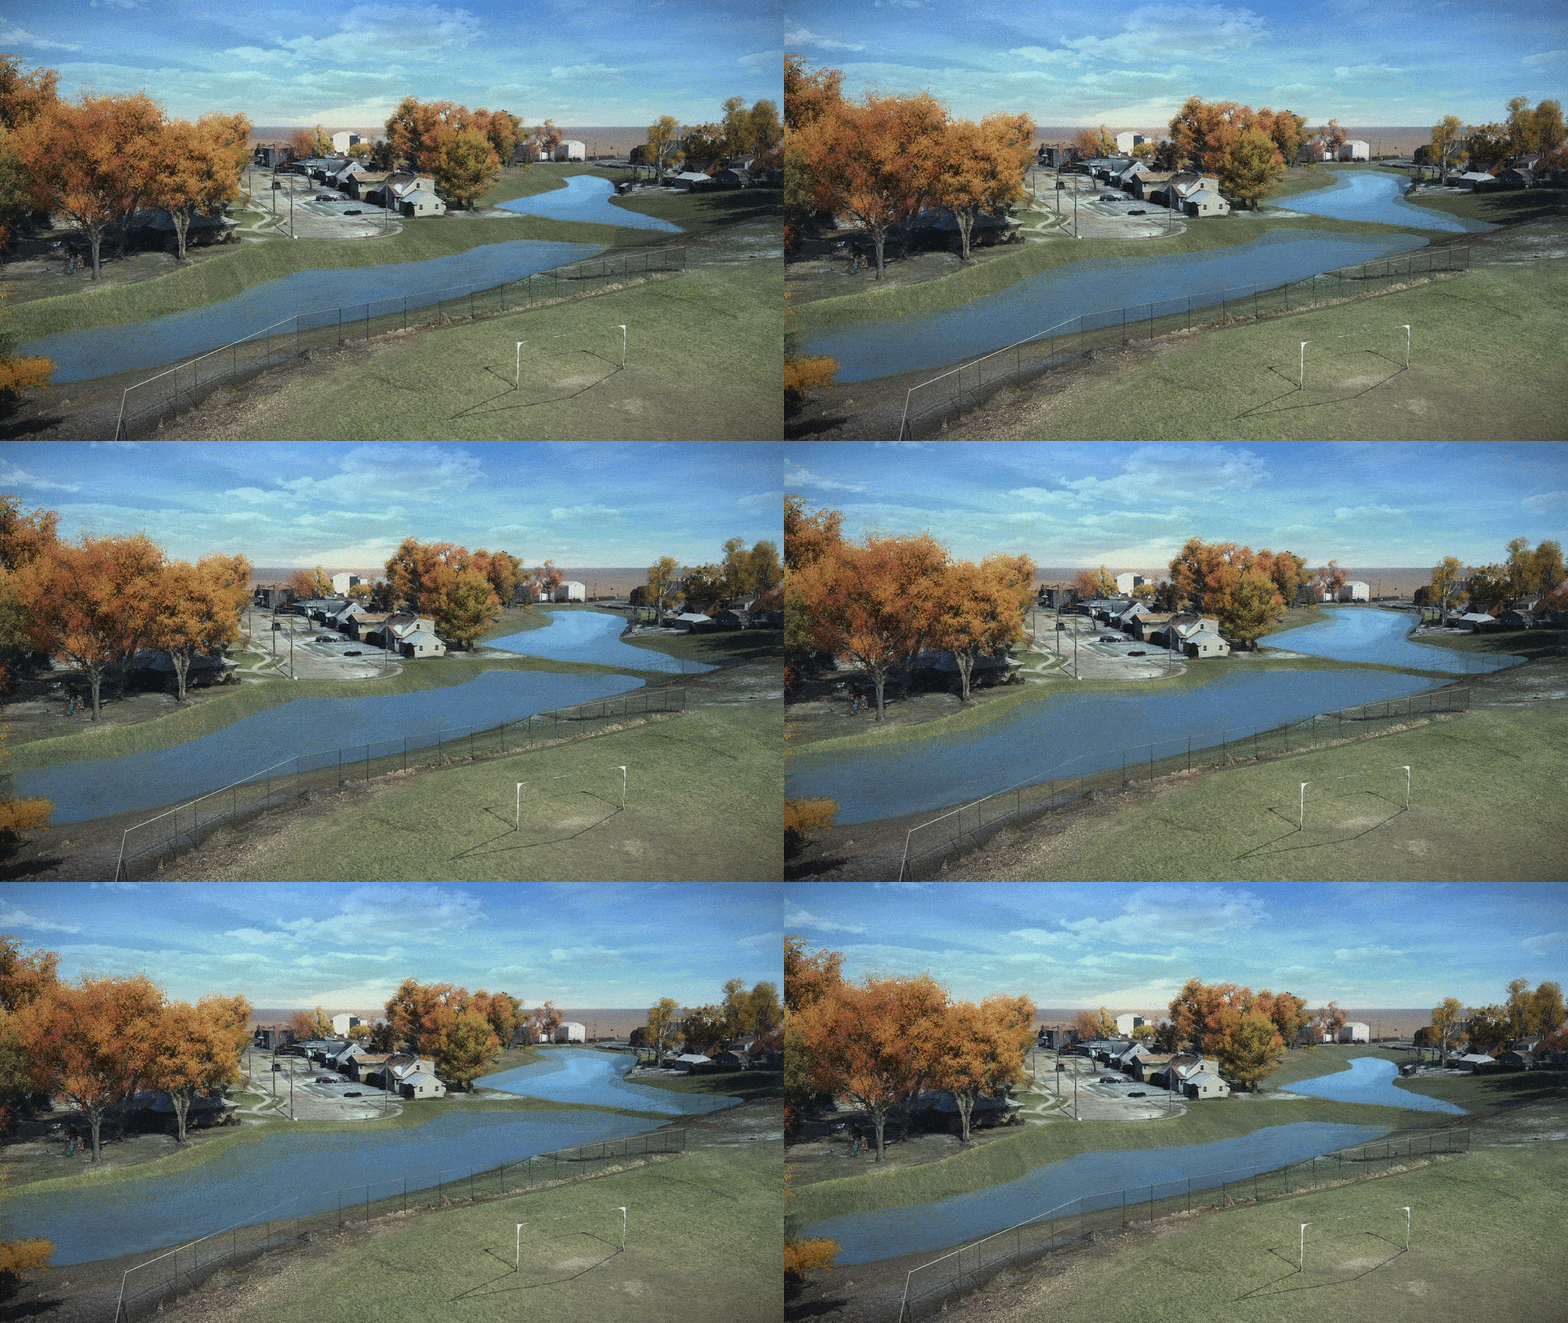
Animated imagery can be used to show various stages of a proposed design feature, like this drainage basin in Closes Creek Watershed.
