Sewer Flow Monitoring Identifies Defects & Deterioration
As communities face the burden and costs of increasingly stringent wastewater treatment standards, the need for sanitary sewer system maintenance and flow monitoring couldn’t be stronger. Through regular observation, sewer system deterioration, defects, and flow issues can be identified. As a result, communities can take a proactive approach to keep their sanitary sewer system functioning properly and avoid unexpected costs. The wastewater experts at Snyder & Associates have been providing this critical service to our client communities for many years.
What is Flow Monitoring?
Flow monitoring uses equipment to read and record flow depth and rate to determine if issues are resulting from inflow/infiltration (I/I), or both. Using the data gathered, it’s possible to plan and design a sanitary sewer rehabilitation approach to correct (I/I) issues at targeted locations. Once sewer rehab is complete, another round of flow monitoring is often beneficial to illustrate how effective the improvements are. In addition to I/I investigations, flow monitoring is also helpful for:
- Signaling overflow alarms that alert wastewater facility staff to issues within the sewer network
- Determining the capacity of an existing sanitary sewer system and whether upgrades are needed to accommodate new development
- Billing for communities that pump their wastewater to another community for treatment
Specialized Flow Monitoring Equipment & Methods
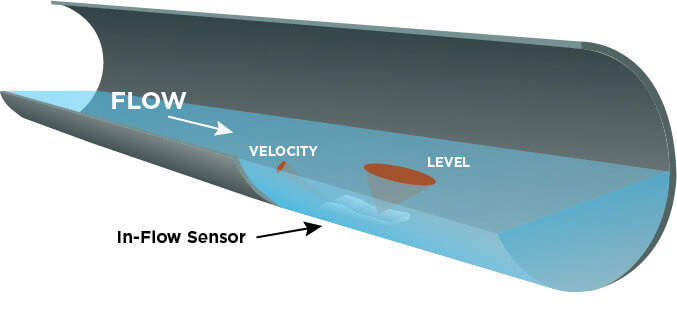
Flow monitoring equipment consists of two parts — a monitor/logger and a sensor. The monitor/logger is installed below a specific manhole cover to record and store information gathered by the sensors that read the sewer flow. Information can be downloaded in the field directly from a laptop or uploaded to the cloud via satellite or cellular connection for viewing on a desktop computer or a smartphone app. Based on a community’s needs and constraints, there are four sensor types to choose from — three are in-flow and the other is a long-range sensor that doesn’t come in contact with wastewater.
In-Flow Sewer Monitoring
The first type of in-flow sensor mounts on the bottom of a sewer pipe. Velocity, depth, and temperature measurements are gathered as wastewater flows past the unit. An ultrasonic depth sensor within the unit bounces a radar beam off the water surface and back down to gain depth information. If the pipe is full due to surcharging, a surface isn’t available for the ultrasonic depth sensor to read. In these instances, a pressure-depth sensor can be used to read what’s going on in the pipe. Using pressure-depth sensor results in the most accurate velocity reading because it averages velocity throughout the entire depth of the flow and accounts for surcharging. However, human entry is required for installation, which is a disadvantage. The sensor also requires a minimum flow depth to work and excessive debris can easily foul the sensor.
The third type of in-flow sensor mounts on top of the pipe. It shoots a beam down into the flow that bounces off the surface to measure velocity. Not every sensor comes equipped to measure pressure, but it’s an option to measure surcharge conditions. Because the sensor installs on the top of the pipe, it’s less susceptible to debris. However, human entry is still required for installation and these sensors are slightly more costly. Additionally, velocity readings may not be as accurate as those provided by the bottom-mounted sensor because measurements come only from the surface.

Long-Range Depth Monitoring
Mounted directly below a manhole lid, long-range depth monitors investigate the manhole invert below. They gather an accurate reading of flow depth, are the least costly, don’t require confined-space entry, and are a great option for operators that would like flow alarms. The inability to measure velocity makes them best suited for situations where depth is the primary concern. For flow rate estimation, the ideal manhole should have a uniform and well-formed invert at the bottom, so not all manholes are suited for this type of technology.
Investigating Inflow & Infiltration (I/I) with Sewer Flow Monitoring
Proper flow monitoring can identify the presence, abundance, and type of I/I issues that exist within a community’s sewer system. Specifically, it can help determine whether pipes are undersized at a specific location, which pipes require replacing, and where leaks might cause significant challenges. Inflow and Infiltration can often result in adverse environmental impacts, regulatory compliance issues, increased treatment costs, and overuse of your collection system. Flow monitoring is the first step in identifying where problems are occurring and can empower communities to set up continuous, proactive flow monitoring programs.
Flow Data Collection & Analytics

A scatter graph measures depth versus velocity after flow metering.
Recent flow monitoring advancements allow operators to rely on sensors and recording devices to automatically read and document flow depth and rate to determine if inflow and infiltration issues are occurring within a system. Municipalities can glean important additional system information from the collected data. This includes determining whether the system is consistently operating in free-flow conditions, specifying the presence of sanitary sewer overflows (SSO) and backwater conditions, and quantifying available capacity.
However, the amount of data collected and the frequency at which measurements occur can easily become overwhelming. One significant improvement to flow monitoring technology is how we can now collect, assemble, and share data. Through software advancements, accumulated data can be displayed in a way that is easier to comprehend. Typically, this is done through two types of graphs, a hydrograph or a scatter graph.
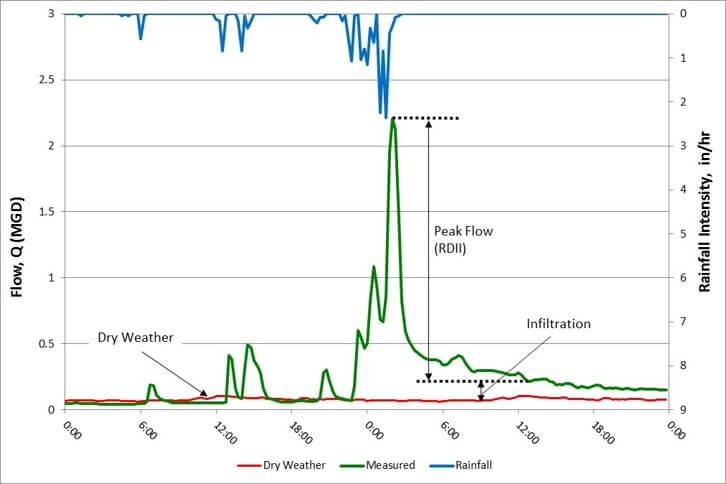
A hydrograph measures flows versus time in different conditions.
A hydrograph displays flow rate over time. This creates a trend of responses to rainfall events allowing for proactive mitigation. A scatter graph plots depth versus velocity within a system. When plotted, data points cluster together, highlighting outliers that could disrupt outcomes and, eventually, solutions. Displaying data in these straightforward graphs can be valuable when presenting to the public to help illustrate how effective renovations were or to show potential problem sites where funding is necessary.
This wide range of information can be used to guide community improvement decisions and long-term goals. Snyder & Associates helps achieve these organizational goals by delivering data that can be used with confidence.
Using Flow Monitoring to Right-Size Treatment Facility Design
For communities that are looking to upgrade, expand, or replace their wastewater treatment facility, flow monitoring is also beneficial to the design and construction process. High flows from stormwater I/I means that any upgrades or changes to a community’s wastewater treatment system must be designed with that flow and capacity in mind. It’s also imperative to remember that with larger facilities comes greater planning, design, construction, operation, and maintenance costs. Steve Klocke, P.E., a seasoned Civil Engineer for Snyder & Associates points to the growing need for many communities to add disinfection to their wastewater treatment facility. He states that disinfecting not only the incoming wastewater but also any added stormwater or groundwater that’s diluting it, “can substantially increase the size of the infrastructure needed and the costs associated with it.”
Taking steps to reduce I/I before the design and construction of wastewater treatment upgrades will save the community money in the long term because the facility will be appropriately sized. Flow monitoring identifies where I/I issues exist and quantifies them, which empowers communities to make informed decisions. “Budgets are always limited, so community infrastructure decisions need to be made with the big picture in mind,” shares Klocke. “Before making changes or upgrades to your wastewater treatment facility, it’s wise to investigate the sewer system leading to it because you can save money and avoid headaches later on.”
Flow Monitoring: Our Approach & What to Expect
The first step of any flow monitoring project is to develop a plan that guides the investigation. For the team at Snyder & Associates, this process starts by dividing the system into catchments, or smaller regions of infrastructure that are the same age or material. This approach allows the engineering team to focus on areas that are relatively similar and help narrow down areas where I/I could be occurring. As far as investigating inflow and infiltration, flow monitoring studies can take anywhere from three to six months on average, with the weather playing an important role in the monitoring process. Dry weather establishes base flows, while wet weather helps the engineering team understand when and where flows are surging. Sharp increases during storms are likely from stormwater inflow, while long durations of increased flow after a storm indicate groundwater infiltration.
“If your community is experiencing backups, overflows, or planning any sort of treatment system upgrade, flow monitoring is a good place to start. It’ll help you understand where you are today, quantify the value of rehabilitation, and plan for the future,” concludes Klocke.